
问题标题
如何实现柱形图同维度数据前后重叠而不是堆叠效果?
问题描述
类似 (https://www.visactor.io/vchart/demo/bar-chart/stack-column)这样的堆积柱状图,
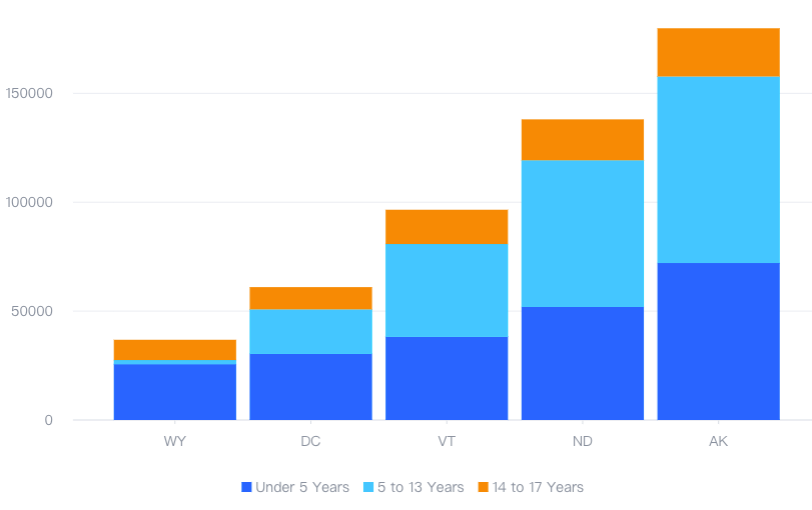
想要实现不同颜色的柱子都从y轴0刻度开始画,前后重叠,而不是上下堆积,该如何实现?
解决方案
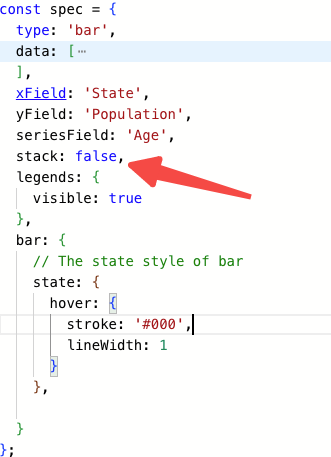
不同图表库的解决方案不一样,根据你给的demo,只需要将控制堆叠的字段设置为false 即可。
代码示例
const spec = {
  type: 'bar',
  data: [
    {
      id: 'barData',
      values: [
        {
          State: 'WY',
          Age: 'Under 5 Years',
          Population: 25635
        },
        {
          State: 'WY',
          Age: '5 to 13 Years',
          Population: 1890
        },
        {
          State: 'WY',
          Age: '14 to 17 Years',
          Population: 9314
        },
        {
          State: 'DC',
          Age: 'Under 5 Years',
          Population: 30352
        },
        {
          State: 'DC',
          Age: '5 to 13 Years',
          Population: 20439
        },
        {
          State: 'DC',
          Age: '14 to 17 Years',
          Population: 10225
        },
        {
          State: 'VT',
          Age: 'Under 5 Years',
          Population: 38253
        },
        {
          State: 'VT',
          Age: '5 to 13 Years',
          Population: 42538
        },
        {
          State: 'VT',
          Age: '14 to 17 Years',
          Population: 15757
        },
        {
          State: 'ND',
          Age: 'Under 5 Years',
          Population: 51896
        },
        {
          State: 'ND',
          Age: '5 to 13 Years',
          Population: 67358
        },
        {
          State: 'ND',
          Age: '14 to 17 Years',
          Population: 18794
        },
        {
          State: 'AK',
          Age: 'Under 5 Years',
          Population: 72083
        },
        {
          State: 'AK',
          Age: '5 to 13 Years',
          Population: 85640
        },
        {
          State: 'AK',
          Age: '14 to 17 Years',
          Population: 22153
        }
      ]
    }
  ],
  xField: 'State',
  yField: 'Population',
  seriesField: 'Age',
  stack: false,
  legends: {
    visible: true
  },
  bar: {
    // The state style of bar
    state: {
      hover: {
        stroke: '#000',
        lineWidth: 1
      }
    },

  }
};</br>
结果展示
在线效果参考:https://codesandbox.io/s/bar-chart-stack-false-cr6667
相关文档
堆积柱形图demo:https://www.visactor.io/vchart/demo/bar-chart/stack-column
柱形图教程:https://www.visactor.io/vchart/guide/tutorial_docs/Chart_Types/Bar
相关api:https://www.visactor.io/vchart/option/barChart#stack
github:https://github.com/VisActor/VChart